auN: a new metric to measure assembly contiguity
Given a de novo assembly, we often measure the “average” contig length by N50. N50 is neither the real average nor median. It is the length of the contig such that this and longer contigs cover at least 50% of the assembly. A longer N50 indicates better contiguity. We can similarly define Nx such that contigs no shorter than Nx covers x% of the assembly. The Nx curve plots Nx as a function of x, where x is ranged from 0 to 100.
In my opinion, there are two problems with N50. First, N50 is not contiguous. For a good human assembly, contigs of lengths around N50 can differ by several megabases in length. Discarding tiny contigs may lead a big jump in N50. Relatedly, between two assemblies, a more contiguous assembly might happen to have a smaller N50 just by chance. Second, N50 may not reflect some improvements to the assembly. If we connect two contigs longer than N50 or connect two contigs shorter than N50, N50 is not changed; N50 is only improved if we connect a contig shorter than N50 and a contig longer than N50. If we assembler developers solely target N50, we may be misled by it.
Here is an idea about how to overcome the two issues. N50 is a single point on the Nx curve. The entire Nx curve in fact gives us a better sense of contiguity. The following figure from a NIBS workshop shows a good example:
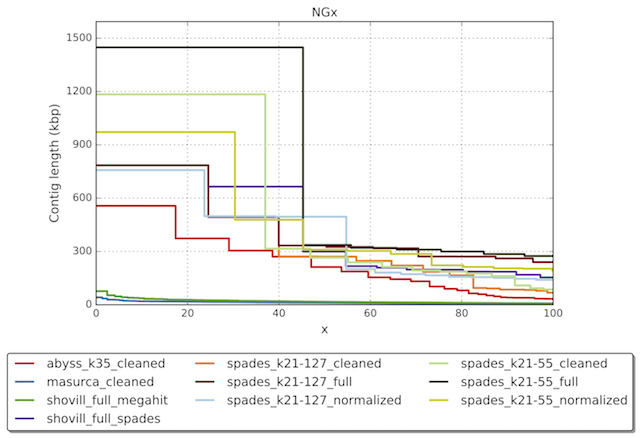
Notably, the NG50 (similar to N50) of several assemblers/settings are about the same around 300kb, but it is clear the black curve achieves better contiguity – a single contig on that curve covers more than 40% of the assembly. Intuitively, a better Nx curve is “higher”, or has a larger area under the curve. Then we can take the area under the curve, abbreviated as “auN”, as a measurement of contiguity. The formula to calculate the area is:
\[{\rm auN}=\sum_i L_i\cdot\frac{L_i}{\sum_j L_j}=\left.\sum_i L_i^2 \middle/ \sum_j L_j\right.\]where $L_i$ is the length of contig $i$. Although auN is inspired by the Nx curve, its calculation actually doesn’t require to sort contigs by their lengths. It is easier to calculate in practice. For multiple human assemblies at my hand, auN falls between N50 and N40, though this observation doesn’t hold for other assemblies in general.
auN doesn’t have the two problems with N50. It is more stable and less affected by big jumps in contig lengths. It considers the entire Nx curve. Connecting two contigs of any lengths will always lead to a longer auN. If we want to summarizes contig contiguity with a single number, auN is a better choice than N50. Similarly we can define auNG and auNGA. I don’t think auN will be widely used given the inertia on N50, but it is anyway fun to ponder new metrics.
Update: Gregory Concepcion pointed out that the GAGE benchmark was using the same metric to evaluate assemblies, though the authors were not interpreting it as area under the Nx cure. Ivan Sovic and Jens-Uwe Ulrich have independently come up with auN as well.
blog comments powered by Disqus